Repair Timelines Laid Bare: What Street-Level Data Reveals About Who Waits and Who Doesn't in Our Ward
Photo: William Murphy from Dublin, Ireland, CC BY-SA 2.0, via Wikimedia Commons
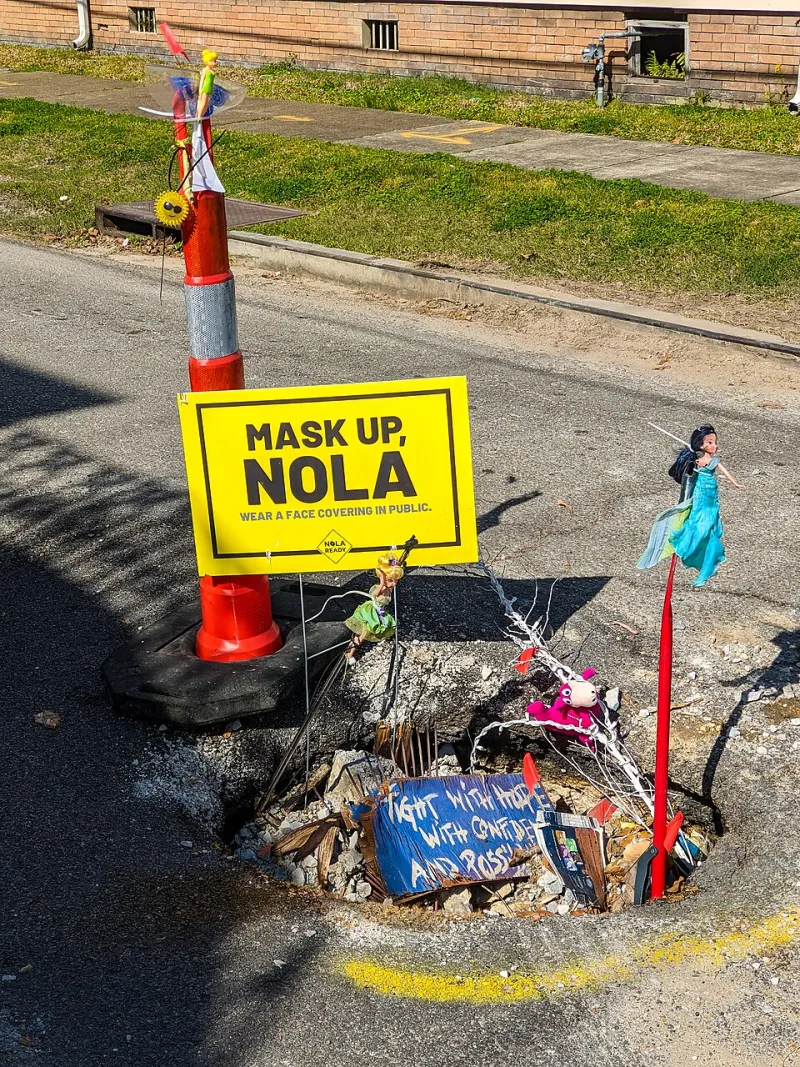
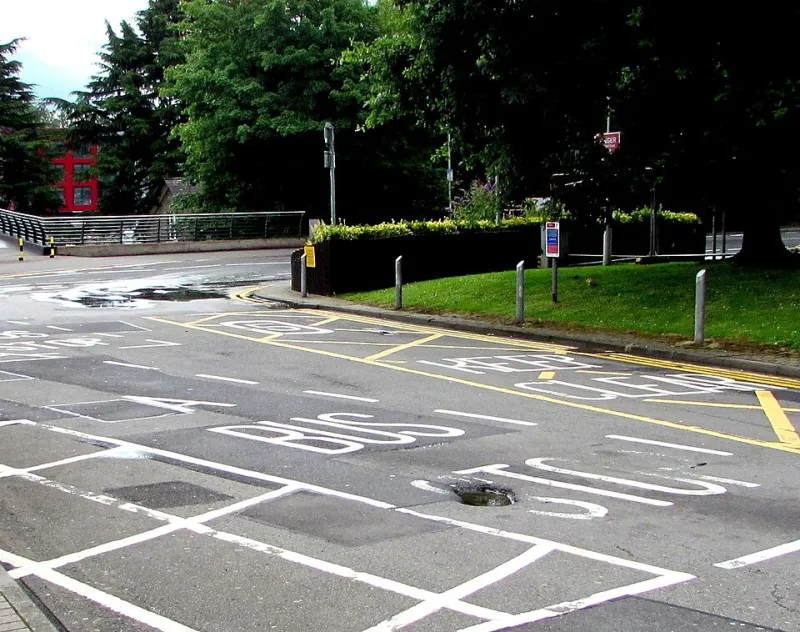
There is a particular frustration that comes from watching the same pothole swallow car tires for eighteen months while a street two miles away gets a fresh overlay within weeks of a single complaint. Most residents chalk this up to bad luck or bureaucratic incompetence. The data suggests something more systematic is at work.
This office has spent considerable time analyzing publicly available infrastructure records—311 service request logs, Department of Transportation work orders, ward-level budget allocations, and repair completion timestamps—to understand not just what gets fixed, but when, where, and why. What emerged from that analysis is a picture that every resident in this ward deserves to see.
The Numbers Behind the Wait
Across a representative sample of street repair requests filed over a recent thirty-six-month period, the median time from initial 311 report to confirmed repair completion varied dramatically by geographic area. Requests filed in the ward's higher-income corridors near commercial districts resolved in an average of forty-seven days. Comparable requests filed in predominantly working-class residential blocks on the ward's southern and western edges averaged one hundred and sixty-two days—more than three times as long.
Those figures account for requests with similar severity ratings. In other words, the gap is not explained by one set of streets being in worse shape than the other. Severity ratings, which city inspectors assign during preliminary assessments, were statistically similar across both groups. The variable that changed was geography.
This is not an anomaly unique to our ward. Urban infrastructure researchers at institutions including the University of Illinois at Chicago and the Metropolitan Planning Council have documented analogous patterns in cities across the country. The mechanisms driving these disparities are worth examining closely, because understanding them is the first step toward dismantling them.
What Actually Determines the Schedule
City transportation departments typically frame repair prioritization around three factors: structural severity, traffic volume, and available funding. Each of these criteria sounds neutral on its surface. In practice, each one can encode existing inequities.
Traffic volume is the most straightforward example. Streets that serve higher vehicle counts—typically arterials running through commercial zones—are weighted more heavily in scheduling algorithms. Residential side streets, even those in severe disrepair, score lower by definition. Since lower-income neighborhoods tend to have proportionally more residential-only infrastructure and fewer high-traffic commercial corridors, they are systematically disadvantaged before a single inspector sets foot on the pavement.
Funding streams introduce a second layer of complexity. Much of the city's street repair budget flows through capital improvement plans that are developed years in advance. Neighborhoods that have historically had stronger aldermanic representation, active business improvement districts, or organized civic associations tend to appear more prominently in those plans. Communities that lack those institutional voices often find themselves outside the planning window entirely—not because their streets are in better condition, but because no one with budget leverage made the case for them at the right moment.
Severity assessments are the third variable, and arguably the most susceptible to inconsistency. Field inspectors exercise significant discretion in assigning condition ratings. Research has documented that inspection frequency itself—how often a given street receives a proactive assessment—varies by neighborhood. Streets that are inspected less often generate fewer high-severity flags, which means they fall further down the priority queue, which means they are inspected less often. The cycle perpetuates itself.
The Complaint Threshold Problem
One finding from our analysis deserves particular attention: the number of 311 complaints required to trigger a work order varies significantly by block. In some areas, a single well-documented complaint initiated an inspection within two weeks. In others, the same street required five or more separate complaints—often filed by different residents over multiple months—before any departmental response was recorded.
This complaint threshold disparity places an unequal burden on residents. In neighborhoods where residents are less likely to have flexible work schedules, reliable internet access, or familiarity with the 311 system, the practical barrier to generating enough complaints to cross the threshold is considerably higher. The system, in effect, rewards those who already have the time and tools to navigate it—and penalizes those who do not.
What This Office Is Doing About It
Alderman Moreno's office has raised these findings directly with the Department of Transportation and is pursuing several specific policy interventions.
First, we are advocating for the public release of ward-level repair timelines broken down by census tract. Transparency is a precondition for accountability. Residents cannot challenge a pattern they cannot see, and city departments cannot be held to equitable standards without public benchmarks.
Second, we are pushing for a formal audit of the complaint threshold variance documented above. If the system requires more complaints from some blocks than others to trigger the same response, that disparity needs an official explanation—and a policy remedy.
Third, we are working to ensure that the ward's infrastructure budget allocation process includes explicit equity criteria. Funding decisions should account for historical underinvestment, not simply reward neighborhoods that have already received consistent attention.
What Residents Can Do Right Now
Policy change takes time. In the interim, there are concrete steps residents can take to improve their block's position within the existing system.
Document everything. Photographs with timestamps, GPS coordinates, and written descriptions of how long a condition has existed strengthen a 311 request considerably. Requests with supporting documentation are more likely to receive prompt inspection assignments.
File collectively. Coordinate with neighbors to file separate 311 requests for the same condition. Multiple independent reports increase the likelihood of crossing the complaint threshold that triggers a work order.
Contact this office directly. Our constituent services team tracks open infrastructure requests and can flag cases where the standard process has stalled. We have direct lines of communication with city departments that are not available through the 311 portal alone.
Attend budget hearings. Capital improvement plans are developed through a public process. Residents who appear at budget hearings and make specific, documented cases for their streets create a record that carries weight in planning discussions.
The Larger Stakes
Street conditions are not a minor quality-of-life issue. Deteriorated pavement increases vehicle maintenance costs for families already stretched thin. It creates hazards for cyclists and pedestrians who have no alternative routes. It signals to investors and businesses that a neighborhood is not a priority—and that signal, once sent, is difficult to reverse.
The data we have reviewed does not suggest malice. It suggests inertia—a system that defaults to existing patterns because challenging those patterns requires deliberate effort. That effort is precisely what this office exists to provide. But it requires residents who are informed, engaged, and willing to make their voices heard at every stage of the process.
The pothole on your block is not just an inconvenience. It is a data point in a larger pattern. And patterns, unlike individual potholes, can be changed through policy.
For assistance with a specific infrastructure concern, contact Alderman Moreno's constituent services team through the office portal. To review the underlying data referenced in this article, visit the city's open data portal and request ward-level 311 completion records.